It is an important data structure in R.
Syntax: data.frame() everything will be declared within the parenthesis.
Data Frames:
– Generated by combining multiple vectors
– It can be created by using external files when importing the data into R.
I am not sure how to share what I learned about data frame in just one blog entry. It works slightly different than matrices, where data frame can contain different modes of data. See example below:
#Create the data frame.
emp.data <- data.frame(
emp_id = c(1:5),
emp_name = c("Rick","Dan","Michelle","Ryan","Gary"),
salary = c(623.3,515.2,611.0,729.0,843.25),
start_date = as.Date(c("2012-01-01", "2013-09-23", "2014-11-15", "2014-05-11","2015-03-27"))
)
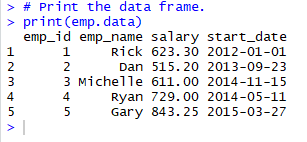
#Print the data frame.
print(emp.data)
A data frame is created called emp.data which contains of number for emp_id, characters for emp_name, floating points for salary and date for start working date. The output of the data frame on the console when I print(emp.data) is as below:
In data frame, the column names are taken from the variable names of the vectors.
Data frame has several built-in R functions which are quite useful. Follow the examples below:
str(emp.data)
– When I execute the above code, the console shows:
‘data.frame’: 5 obs. of 4 variables:
$ emp_id : int 1 2 3 4 5
$ emp_name : Factor w/ 5 levels “Dan”,”Gary”,”Michelle”,..: 4 1 3 5 2
$ salary : num 623 515 611 729 843
$ start_date: Date, format: “2012-01-01” “2013-09-23” “2014-11-15” “2014-05-11” …
Do you know why it is 5 objects? Yes, 4 vectors and a data frame.
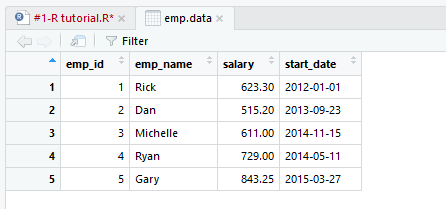
View(emp.data)
– View the data in tabular format.
– Navigate to the top left box in the RStudio, I see another tab named with empdata displayed.
– Use it often to check or view data.
Cool, right?
Next cool things we can do with data frame is using the summary(emp.data).
– Print out the summary and it shows the min, max, median, mean, 1st quarter and 3rd Quarter. In some statistics analysis, this is very useful piece of information.
– How to do extract just min, median and max values from the summary()?
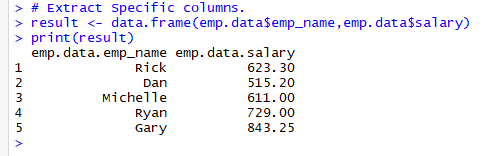
What if I want to extract specific columns from the data frame? How does it can be done? Below codes explain and the output on the console. I can access to the columns in the data frame by using “$” symbol.
#Extract Specific columns.
 result <- data.frame(emp.data$emp_name,emp.data$salary)
 print(result)
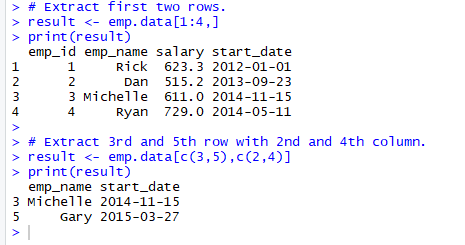
Accessing the data frame.
– Extract information of a specific rows and columns.
– Extract using head() and tail().
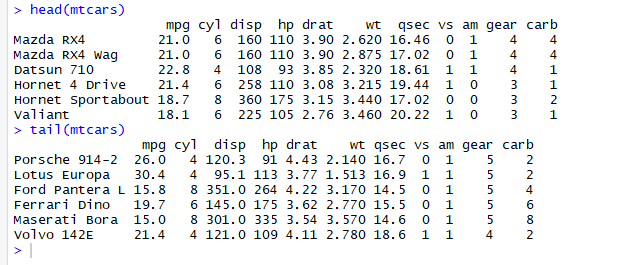
In a larger data frame, it is quite useful function to extract top 6 records and last 6 records. The example from the workshop is not large enough to see the different, so let try head(mtcars) and tail(mtcars).
mtcars is built-in data frame in RStudio.
To add another “column”, it can be done directly with codes below:
emp.data$dept < – c(“IT”,”Operations”,”IT”,”HR”,”Finance”).
Then, map it to a variable to print out on the console using the following codes,
#Add the "dept" column.
 emp.data$dept <- c("IT","Operations","IT","HR","Finance")
 v <- emp.data
 print(v)
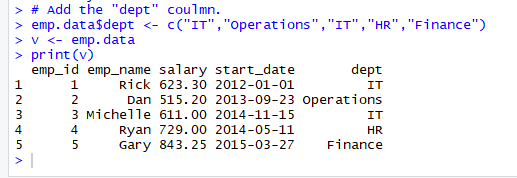
The key is using “$“, the same key I used to extract or access data from emp.data data frame.
I will share more on data frames when I come across interesting codes. Stay tuned. Thank you.


